


Regular readers are well aware that back in July, Zero Hedge first (long before it became a running theme among so-called “macro experts”) pointed out that a gaping 1+ million job differential had opened up between the closely-watched and market-impacting, if easily gamed and manipulated, Establishment Survey and the far more accurate if volatile, Household Survey – the two core components of the monthly non-farm payrolls report.
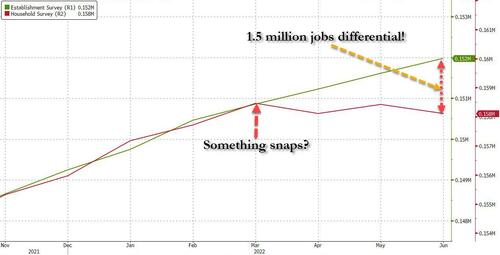
We first described this divergence in early July, when looking at the June payrolls data, we found that the gap between the Housing and Establishment Surveys had blown out to 1.5 million starting in March when “something snapped.” We described this in “Something Snaps In The US Labor Market: Full, Part-Time Workers Plunge As Multiple Jobholders Soar.”
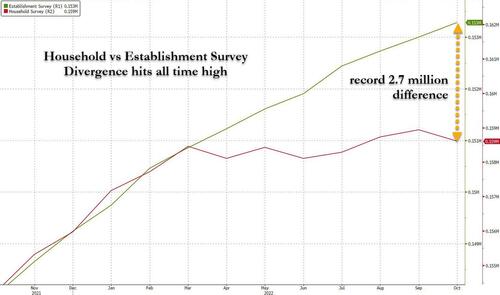
Since then the difference only got worse, and culminated earlier this month when the gap between the Establishment and Household surveys for the November dataset nearly doubled to a whopping 2.7 million jobs, a bifurcation which we described in “Something Is Rigged: Unexplained, Record 2.7 Million Jobs Gap Emerges In Broken Payrolls Report.”
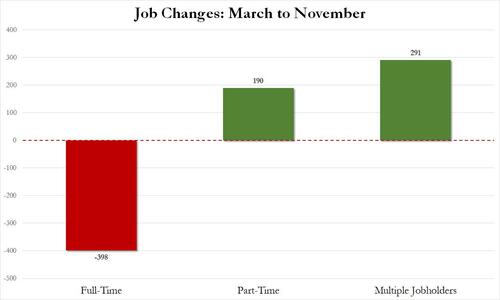
Whether this divergence was due to wrong seasonal adjustments (a remnant of the overreaction taken by the Dept of Labor following the covid crunch to normalize for a new normal labor market), due to erroneous Birth-Death assumptions (here too, the Dept of Labor was assuming early cycle new business creation which clearly is wrong with the economy late cycle and millions of businesses shutting down, ignoring the open PPP fraud that took place in early/mid-2000s as everyone “opened up” businesses to get free money from the government), due to the Establishment Survey inability to tell the difference between full, part and multiple-jobs – as a reminder we first showed that since March, the US had lost 400K full-time jobs offset by far lower paying part-time jobs as well as double-counted multiple jobholders…
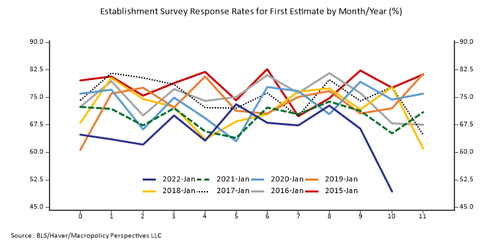
… due to the record high rate of estimation – recall the 49% Establishment survey response rate was much lower than the 70-75% rate typical in November, meaning the Dept of Labor was literally making numbers up to “complete” the survey…
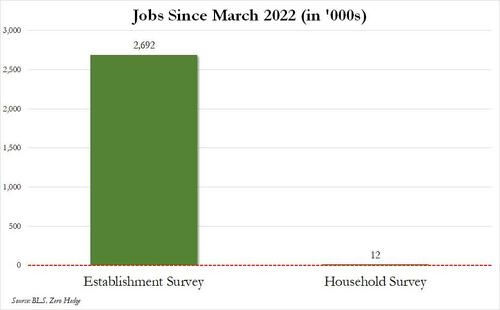
… or some other reason, perhaps including the Biden admin tapping certain Bureau of Labor Statistics officials on the shoulder and advising them to show strong numbers if they want to keep their… well… jobs, we did not know, but we did know that according to the Household Survey, just 12,000 jobs were created since March, while according to the Establishment Survey – which moves markets and sets Fed policy – the increase in jobs over the same period was 2.692 million!
We bring all this up again because late on Dec 13, the Philadelphia Fed published something shocking: as part of the regional Fed’s quarterly reassessment of payrolls in the form of an “early benchmark revision of state payroll employment”, the Philly Fed confirmed what we have been saying since July, namely that US payrolls are overstated by at least 1.1 million, and likely much more!
First, some background.
As the Philly Fed notes, “estimates by the Federal Reserve Bank of Philadelphia indicate that the employment changes from March through June 2022 were significantly different in 33 states and the District of Columbia compared with current state estimates from the Bureau of Labor Statistics’ (BLS) Current Employment Statistics (CES). Early benchmark estimates indicated higher changes in four states, lower changes in 29 states and the District of Columbia, and lesser changes in the remaining 17 states.
Wait, the Philly Fed tabulates jobs? Isn’t that the jobs of the BLS?
Why yes, the BLS does that every month. The problem is that to successfully publish a report within days after any given month ends, the BLS report gives up in accuracy what it makes up in speed. Far more accurate reports are available elsewhere, they just come with a big lag. This is where the Philadelphia Fed comes in: from the latest quarterly report…
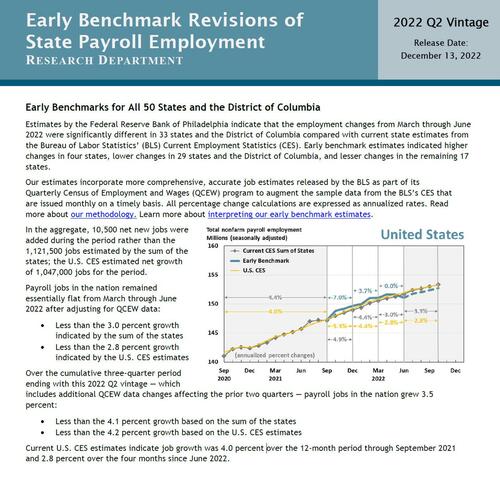
Our estimates incorporate more comprehensive, accurate job estimates released by the BLS as part of its Quarterly Census of Employment and Wages (QCEW) program to augment the sample data from the BLS’s CES that are issued monthly on a timely basis. All percentage change calculations are expressed as annualized rates. Read more about our methodology. Learn more about interpreting our early benchmark estimates.
Ok, ok, what did this “more accurate”, “more comprehensive” report find? It found that…
In the aggregate, 10,500 net new jobs were added during the period rather than the 1,121,500 jobs estimated by the sum of the states; the U.S. CES estimated net growth of 1,047,000 jobs for the period.
Remember what we said in July when we first looked at the March-June divergence between the Household and Establishment survey: we said that “since March, the Establishment Survey shows a gain of 1.124 million jobs while the Household Survey shows an employment loss of 347K!” Said otherwise, we found that payrolls “calculated” by the Establishment Survey were overestimated by 1.5 million. Shockingly, the Philly Fed seems to agree, and reports that instead of the roughly 1.1 million jobs reported by the BLS, only 10,500 new jobs were added!
And some more data:
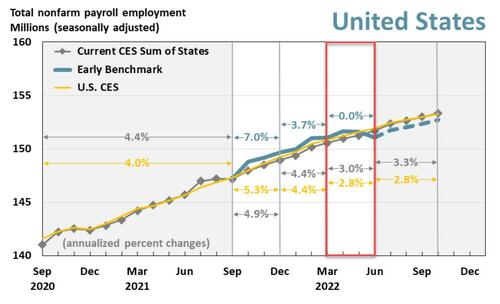
Payroll jobs in the nation remained essentially flat from March through June 2022 after adjusting for QCEW data:
Less than the 3.0 percent growth indicated by the sum of the states
Less than the 2.8 percent growth indicated by the U.S. CES estimates
This is shown graphically in the chart below: specifically, the analysis looks at the quarter in the red box, where the green line, or the more accurate “early benchmark” revision of official data, dipped decidedly below the CES trendline (i.e., the nonfarm payrolls).
For those who are too lazy to click on the source report, here is the summary page:
Of course, the above analysis only looks at the March-June period. What about subsequent months and quarters? Well, we will have to wait at least 3 months to get the June-Sept data, but using the same approach which we now know works, and which looks at the divergence between Household and Establishment surveys, it is safe to say that the job “overstating” which was 1.5 million in June according to Zero Hedge and 1.1 million according to the Philly Fed, has almost doubled to 2.7 million from March to November. The only question is what the final, far more accurate Philly Fed estimate will be when it is published some time in 6 months time.
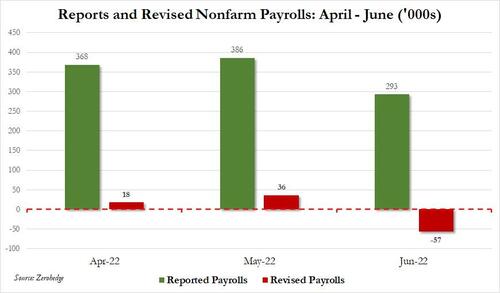
But an even bigger question is when does the BLS realize (or rather admit) what is going on and engages in a shotgun backward revision of data? The most likely answer is that the BLS will simply wait until one of its annual historical data revision periods, when the Bureau of Labor Statistics quietly admits that historical data was higher by a few million, and re-benchmarks current months going forward as if nothing had happened. In the meantime, however, the Fed is shaping monetary policy using the clearly flawed assumption that the US labor market is “hot”, “tight” and “strong”, when in reality we now know that between March and June, monthly payrolls were overstated by about 350,000. This matters because this is what the BLS reported for payrolls for those months:
April 368K
May 386K
June 293K
Now take those numbers and adjust them to subtract an average of 350K from each month (to get the revised Philly Fed payroll over this period) and you get this:
April 18K
May 36K
June 57K
And visually.
Still think the Fed would be hiking 75bps this summer if instead of an average monthly job gain of 350K, Powell was seeing zero monthly payroll increases?
And even more importantly, now that the cat is out of the bag and the Philly Fed has introduced this huge credibility issue in all recent payrolls data, how long until this becomes a political issue, and how long until Republicans – who take control of the House in January – start hearings to demonstrate to the US that the collapse in the labor market did not start with the Republican takeover but was well in place last summer.
And finally, how long until the Fed – which made it clear that it is no longer focused purely on inflation numbers (which are sliding fast anyway) but will also be looking at clearly wrong jobs data – makes it a point that the US labor market is in far worse shape, it is in fact contracting, than it was when it decided to hike 75bps several times in a row?
Story cited here.


